比較兩組直線回歸方程式 (Comparing Two Simple Linear Regression Equations)
套路42: 比較兩組直線回歸方程式
(Comparing Two Simple Linear Regression
Equations)
1. 使用時機: 比較兩組直線回歸方程式統計上是否有顯著差異。
2. 分析類型: 母數分析(parametric analysis)。
3. 範例資料: 咪路測量兩組動物體溫(°C)與脈搏,資料如下:
|
體溫1
|
20.8
|
20.8
|
24
|
24
|
24
|
24
|
26.2
|
26.2
|
26.2
|
26.2
|
28.4
|
29
|
30.4
|
30.4
|
|
脈搏1
|
67.9
|
65.1
|
77.3
|
78.7
|
79.4
|
80.4
|
85.8
|
86.6
|
87.5
|
89.1
|
92.6
|
94.8
|
96.3
|
99.7
|
|
體溫2
|
17.2
|
18.3
|
18.3
|
18.9
|
18.9
|
20.4
|
21
|
21
|
22.1
|
23.5
|
24.2
|
25.9
|
26.5
|
29.6
|
|
脈搏2
|
44.3
|
47.2
|
47.6
|
49.6
|
50.3
|
51.8
|
56.5
|
58.9
|
60
|
63.7
|
69.8
|
72.9
|
77
|
84
|
4. 輸入建立資料:
第一步: 使用基本模組(base)的read.table函數輸入建立資料儲存到變數dat中。
dat <- read.table(header = T, text = "
Species Temp Pulse
ex 20.8 67.9
ex 20.8 65.1
ex 24 77.3
ex 24 78.7
ex 24 79.4
ex 24 80.4
ex 26.2 85.8
ex 26.2 86.6
ex 26.2 87.5
ex 26.2 89.1
ex 28.4 92.6
ex 29 94.8
ex 30.4 96.3
ex 30.4 99.7
niv 17.2 44.3
niv 18.3 47.2
niv 18.3 47.6
niv 18.9 49.6
niv 18.9 50.3
niv 20.4 51.8
niv 21 56.5
niv 21 58.9
niv 22.1 60
niv 23.5 63.7
niv 24.2 69.8
niv 25.9 72.9
niv 26.5 77
niv 29.6 84")
# Species、Temp及Pulse資料以空白分隔。
第二步: 使用基本模組(base)的attach及names函數賦予dat中的資料名稱(標題)。
attach(dat) # 讓R能透過變數名稱搜尋資料。
names(dat) # 賦予資料名稱(標題)。
5. 畫圖看資料分佈:
第一步: 安裝ggplot2程式套件。
第二步: 呼叫ggplot2備用。
library(ggplot2)
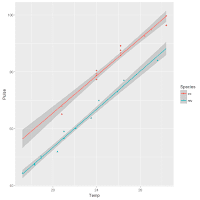
第三步: 使用ggplot2程式套件的函數ggplot代入dat資料畫x-y散佈圖及回歸線。
ggplot(dat, aes(x =
Temp, y = Pulse, color = Species, shape = Species)) +
geom_point() + # x-y散佈圖
geom_smooth(method
= lm, fullrange = TRUE)
# 畫回歸線,及95%信賴區間。
# 灰色區域為95%信賴區間。
6. 使用R比較兩回歸方程式統計上是否有差別:
第一步: 安裝car程式套件。
第二步: 呼叫car備用。
library(car)
第三步: 使用基本模組(base)的lm函數計算回歸模型1。
model1 <- lm(Pulse ~
Temp * Species, data = dat)
第四步: 使用car程式套件的Anova函數計算並顯示結果。
Anova(model1, type =
"II")
第五步: 判讀model1結果。
Anova Table (Type II tests)
Response: Pulse
Sum Sq
Df F value Pr(>F)
Temp 3275.6
1 1165.5187 < 2.2e-16 ***
Species 719.9 1
256.1441 2.625e-14 ***
Temp:Species 0.4 1
0.1538 0.6984
Residuals 67.5 24
---
Signif. codes: 0 ‘***’ 0.001
‘**’ 0.01 ‘*’ 0.05 ‘.’ 0.1 ‘ ’ 1
# H0: b1 = b2,HA: b1 ≠ b2。
# Temp:Species項Pr < 0.05,H0: b1 = b2不成立。
# Temp:Species項Pr > 0.05,H0: b1 = b2成立。
第六步: 使用基本模組(base)的lm函數計算回歸模型2。
model2 <- lm(Pulse ~
Temp + Species, data = dat)
第七步: 使用car程式套件的Anova函數計算並顯示結果。
Anova(model2, type =
"II")
第八步: 判讀model2結果。
Anova Table (Type II tests)
Response: Pulse
Sum Sq Df F
value Pr(>F)
Temp 3275.6 1 1206.35 < 2.2e-16 ***
Species 719.9 1
265.12 8.105e-15 ***
Residuals 67.9 25
---
Signif. codes: 0 ‘***’ 0.001
‘**’ 0.01 ‘*’ 0.05 ‘.’ 0.1 ‘ ’ 1
# H0: 兩條線截距(elevation)相同,HA: 兩條線截距(elevation)不相同。
# 類別變數(Species)項Pr < 0.05,H0: 兩條線截距(elevation)相同,不成立。
# 類別變數(Species)項Pr > 0.05,H0: 兩條線截距(elevation)相同,成立。
來勁了嗎? 想知道更多?? 補充資料(連結):
3. STHDA Linear Regression Essentials in R (http://www.sthda.com/english/articles/40-regression-analysis/165-linear-regression-essentials-in-r/)
4. 關於R基礎,R繪圖及統計快速入門:
a. R Tutorial: https://www.tutorialspoint.com/r/index.htm
b. Cookbook for R: http://www.cookbook-r.com/
c. Quick-R: https://www.statmethods.net/
d. Statistical tools
for high-throughput data analysis (STHDA): http://www.sthda.com/english/
e. The Handbook of Biological Statistics: http://www.biostathandbook.com/
f. An R Companion for the Handbook of
Biological Statistics: http://rcompanion.org/rcompanion/index.html
5. Zar, JH. 2010. Biostatistical Analysis, Fifth Edition,
Pearson.


留言
張貼留言